Google Analytics is a powerful tool for everyone who manage a website and want to track important metrics, which will be used to improve your website’s content, conversions, and user experience.
By implementing Google Analytics code to your website, you can easily access to a huge resource of valuable statistics.
1. Dashboards Overview
The first awesome thing about Google Analytics is the feature of creating Dashboards, which allows you to see the most important analytics data first after logging into your Google Analytics account.
In order to see these data, you can go to “My Dashboard” which is the default setup. The real usefulness of Dashboards lies in your ability to create and customize them the way you want.
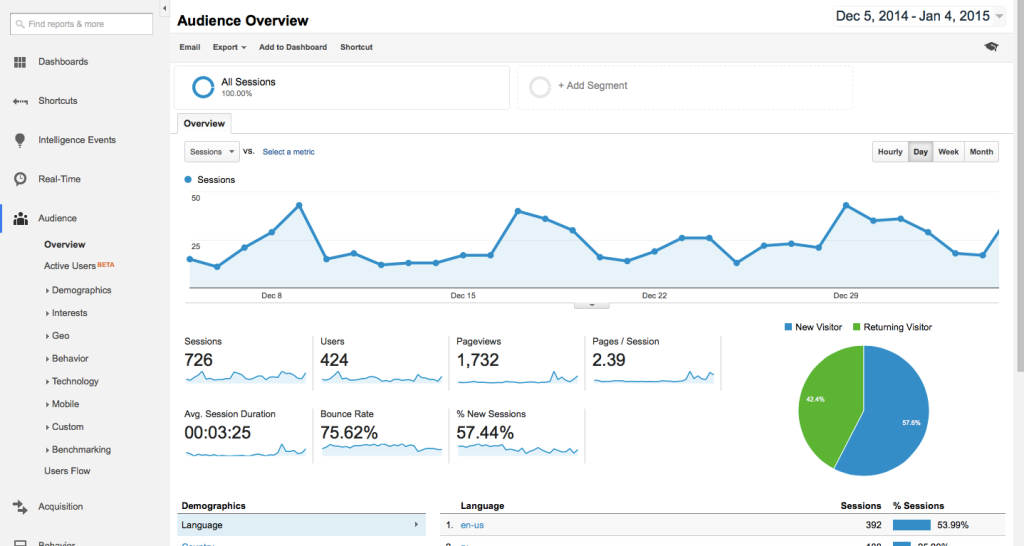
You can create multiple dashboards, each of which can contain multiple widgets (up to 12 per Dashboard) that give you an overview of the dimensions and metrics you care about most.
To create a new dashboard, simply select the Reporting tab in the menu bar of your analytics and then select Dashboards, after that clicking + New Dashboard. Then add widgets to your Dashboard.
There are several kinds of widgets you can choose to add to your Dashboards:
Metric displays a simple numeric representation of a single selected metric.
Timeline displays a graph of the selected metric over time. You can compare this to a secondary metric.
Geomap displays a map of the selected region, with the specified metric plotted on the map.
Table displays up to 2 metrics describing the selected dimension, laid out in tabular format.
Pie displays a pie chart of the selected metric grouped by a dimension.
Bar displays a bar chart of the selected metric grouped by up to 2 dimensions.
From that, you can create many useful Dashboards, such as Mobile commerce dashboards, Site performance dashboards, Blogging dashboards, Realtime overview dashboard,… with the ability of changing date range.
2.See traffic source
The traffic of a website can come from many sources, such as Paid Search, Organic Search, Direct, Referral, Social and Others. You can easily track this information by going to Acquisition, then click to All Traffic.
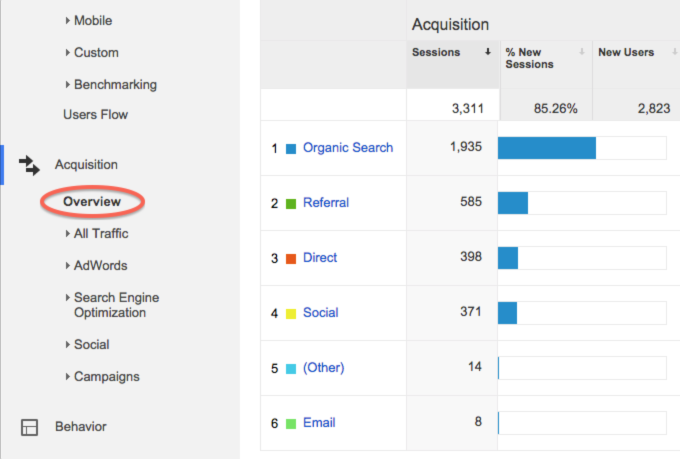 Paid Search – Found your website by clicking on an ad on a search engine (for example: Google).
Organic Search – Clicked to your site with organic search result of a search engine.
Direct – Typed your URL in the browser.
Referral – Clicked on a link from another website that linked back to your site.
Social – Clicked on a link from a social website (for example: Facebook) that linked back to your site.
Email – Clicked on a link in an Email that linked back to your site.
This information gives you insights into your website and the most important information you need when you are running several advertising campaigns, such as Google Adwords, Facebook Ads,…
A healthy website will have a good balance of traffic from all five sources. You will never want to lose traffic from any sources.
3. See what keywords are converting best
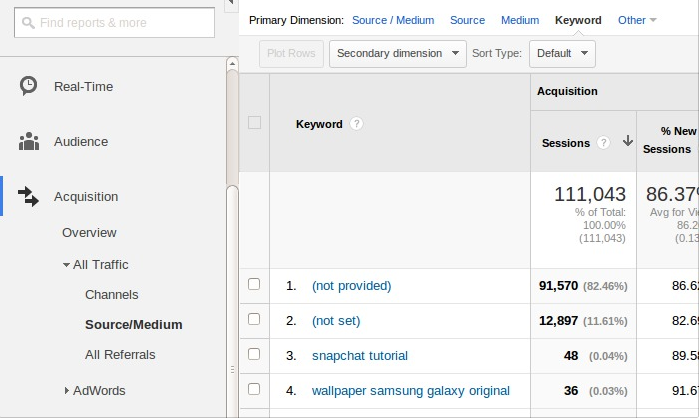
Other important information you can get from Google Analytics is keyword performance. This information is extremely useful when you do keyword research for SEO (Search Engine Optimization) and run Google Adwords campaigns.
To find this information, go to: Acquisition > All Traffic > Channels > Organic Search. This report will provide you a list of all organic keywords that have driven traffic to your site. The default view sorts your keywords by the number of sessions, which is the first metrics.
However, you can click on any of the column heading to resort the keyword list by: Sessions, % New Sessions, New Users, Bounce rate, Pages/Session, Avg. Session Duration, E-commerce Conversion Rate, Transaction and Revenue. The best keywords will have a low bounce rate and high other metrics.
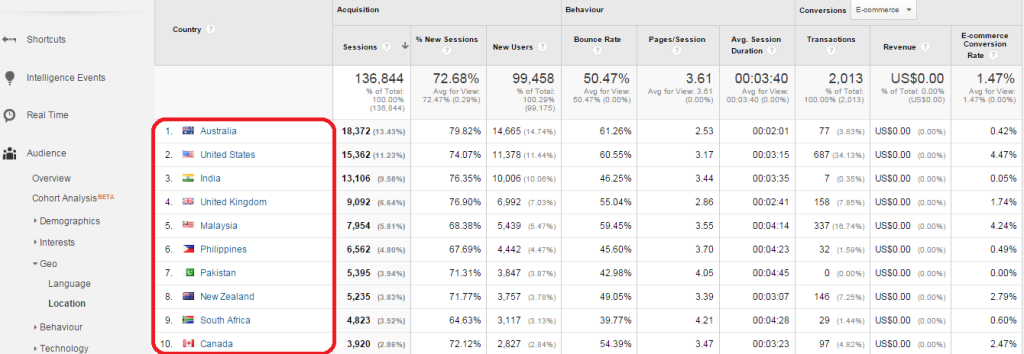
4. Determine where your best visitors are located
If you are thinking of running advertising on Google, Facebook, Bing and other services, or want to improve your advertising campaigns, you definitely need geographic report on Google Analytics. It will show you where your visitors are located, from that point, you will know which areas should be more focused.
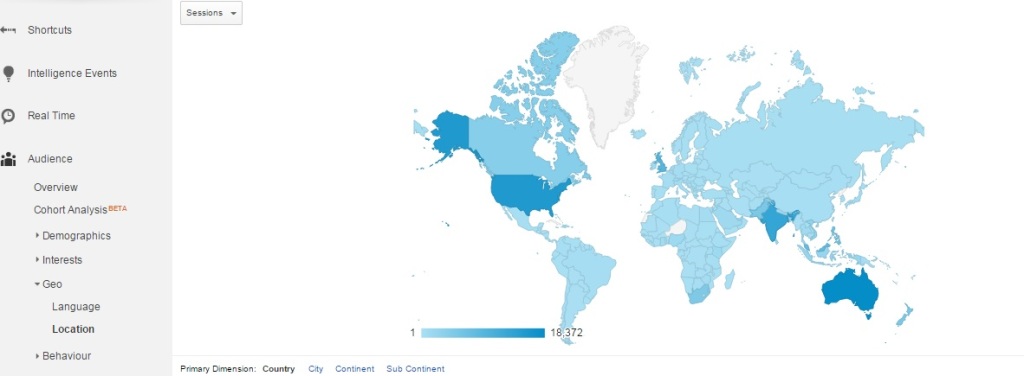 To get this report, simply look under your Audience menu to see the Geo, then click Location geographic of your visitors.
Hence, you can see your worldwide stats, including the number of new users, time on site and bounce rate of visitors from particular countries. You can also drill down one particular country to see the statistics of the area within that country.
5. Real-time report
Real-time reports provide useful insights for online businesses that help them understand how their website are working instantly. The reports are updated continuously, and each hit (An interaction that results in data being sent to Google Analytics.
Common hit types including page tracking hits, even tracking hits, and eCommerce hits) is reported seconds after it occurs. For example, you can see how many people are online on your website, which pages they are viewing and which goal conversions have occurred.
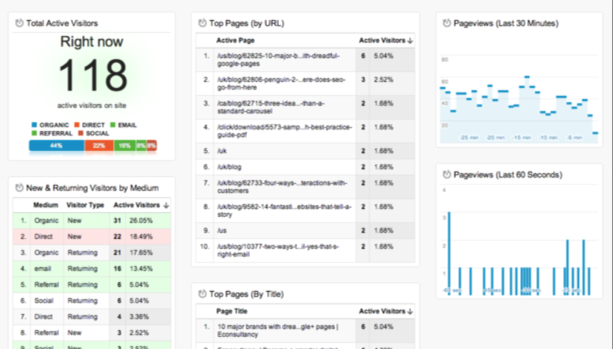
To see Real-time, sign in to your Google Analytics account, then navigate to your view, select the Reporting tab and click Real-time.
There are many things you can do with Real-time, such as:
- Ensuring the Google Analytics tracking code is actually tracking
- Testing that conversions are working
- Determining if new or changed content is being viewed
- Watching if a one-day promotion is driving traffic to your site
- Seeing the immediate effect of a social network post
From that point, you can also know which pages attract your visitors most.
6. Uncover your best and worst performing pages
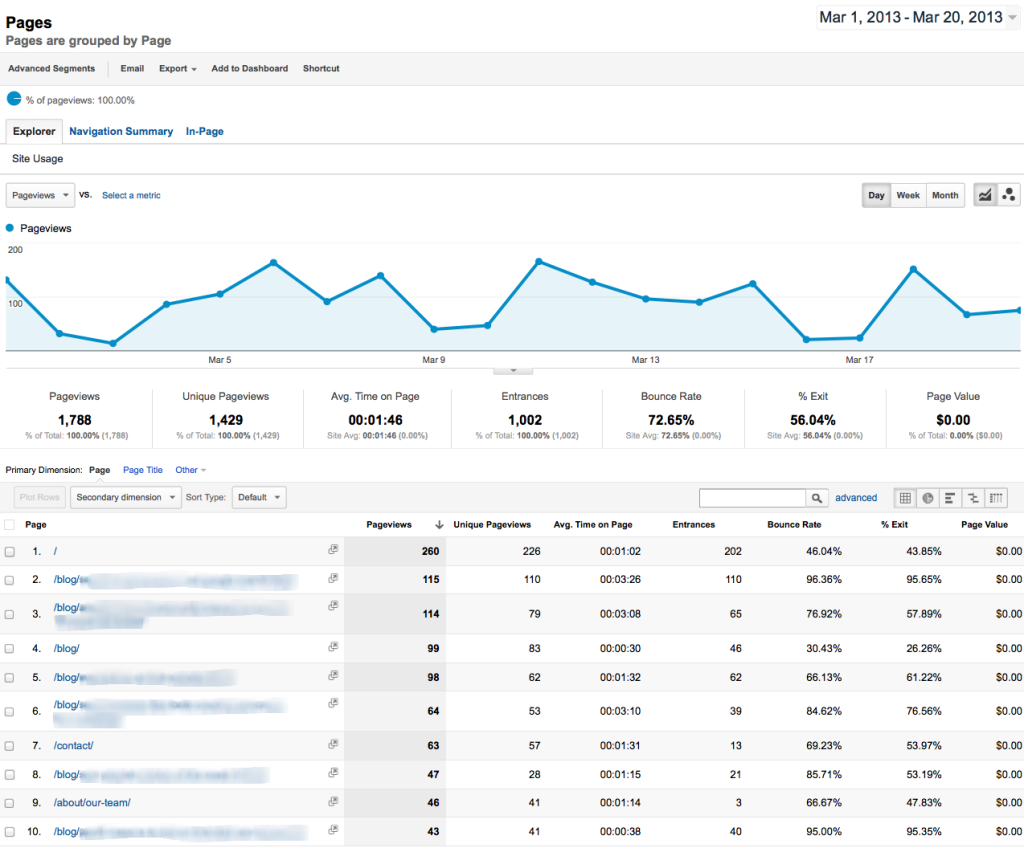 Your website can contain several pages or a hundred pages. Do you know which landing pages have the best/ worst performing with a glance? With Google Analytics, you can uncover these pages easily by going under Behavior menu and selecting Site content.
By looking at some important metrics, such as Page Views, Avg. Time on Page, Bounce Rate, % Exit and Page Value, you will know which pages are converting best on your website that help you produce more content that people will like in the future, and which pages should be improved.
This may mean that you need to evaluate your site’s content to ensure that your content is match what visitors need.